The Problem with Trace Views
If you’re building an agent, you’ve probably used a trace view to debug. In the best case, it’s a list with hundreds, or potentially thousands, of spans. It doesn’t really answer the simple question: what actually happened? Raindrop Trajectories solve this in two ways:- Visualizing agent traces in a sane way: purpose-built for agents, not generic distributed systems
- Making agent trajectories actually searchable: find the trace you need in seconds using natural language
Natural Language Search
You can search across all your agent traces using natural language. Just describe what you’re looking for and Raindrop converts your query into structured filters automatically. For example:- “show me traces where the edit tool failed more than 5 times because it didn’t read the file before”
- “traces where bash was called after a glob error”
- “long-running traces using claude-opus that had tool errors”
Visualization Modes
There are two visualization modes, toggled at the top of the page.Output Size
Output size mode scales each span by its output token count. This helps you instantly spot heavy tool calls, like an agent reading an enormous file or generating an unexpectedly large response.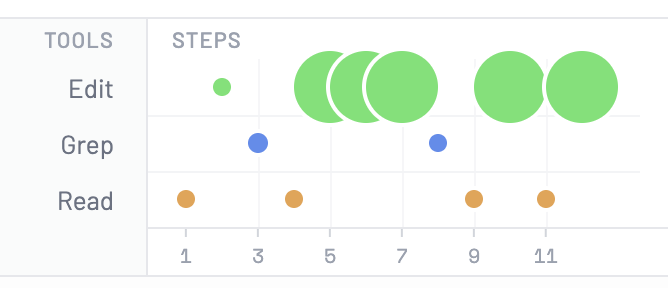
Duration
Duration mode is similar to a flame graph, but optimized for agents. Each span renders as a proportional horizontal bar on a shared time axis, making it easy to identify slow steps and performance bottlenecks.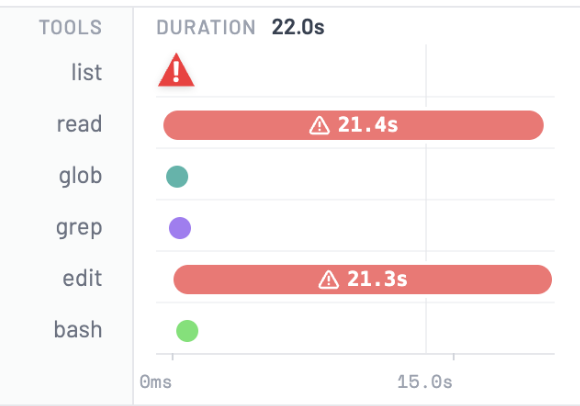
Explain Trajectory
Click Explain on any trajectory row to get an AI-generated summary of what happened. Raindrop analyzes the full sequence of tool calls, their inputs, outputs, errors, and timing, and streams a concise explanation directly into the UI. This is especially useful for long, complex traces where scanning spans manually would take minutes.Filters
Beyond natural language search, you can build precise filters using the filter panel. Filters include:- Signals: filter by any signal (e.g., task failure, user frustration, tool errors)
- Tools: require specific tools to be present in the trace
- Models: filter by AI model used
- Patterns: define tool sequences (e.g., “edit must follow read”)
- Attributes: set minimum tool calls, minimum errors, per-tool count thresholds, and error message search
Span Visibility
You can control which span types are visible in the visualization using the Spans button:- LLM: model generation spans
- Tools: tool call spans
- Other: any additional spans